Public Guest / SOLIVIA
Sign In

Solivia Monitor

System Documentation

A complete reference for every module, interface element, and workflow within the Solivia Monitor platform. This guide covers all functional areas of the application, providing descriptions of screens, controls, and data fields.

New

Platform Video Walkthrough

Watch this automated tour of the Solivia Monitor platform, showcasing the primary navigation, program registries, framework maintenance, and results tracking modules.

Interactive

Open Platform Flipbook →

02

Organisation Dashboard

The Dashboard is the primary landing screen following authentication. It presents an aggregated portfolio view without requiring navigation to individual programme records. The page header displays the authenticated user's name and job title, as configured in the user profile.

Summary Stat Cards

Three metric cards are rendered across the top of the dashboard:

Total Programs

The count of all active programmes registered within the organisation.

On Track

The count of programmes whose status is classified as On Track in the current reporting period.

Total Indicators

The aggregate count of all active indicators across the full programme portfolio.

Portfolio Charts

Program Status DensityA doughnut chart illustrating the distribution of programmes across status categories (On Track, At Risk, On Hold, Completed, etc.).
Lifecycle DistributionA polar area chart presenting the spread of programmes across development lifecycle stages (Design, Implementation, Scale-Up, Closure, etc.).

Recent Programs Table

A tabular list of the five most recently created active programmes. Each row displays the programme name, status badge, and start date. The Manage action navigates to the full programme detail page. The View All control at the table header navigates to the Projects Registry.

03

Projects Registry

Projects Registry

The Projects Registry maintains the master list of all programmes within the organisation. Records can be searched, filtered by status or stage, and navigated to for detailed management.

Toolbar Controls

Search BarFilters the programme list to records whose title matches the entered keyword. Submitting an empty search resets the filter.
+ New ProjectOpens a programme creation form. The new record is automatically assigned to the authenticated user's organisation.

Filter Bar

Status FilterNarrows the list to programmes matching a specific status: On Track, At Risk, On Hold, Extended, Completed, or Cancelled.
Stage FilterNarrows the list by programme lifecycle stage. Stages correspond to the organisation's programmatic phases.
FilterSubmits the selected filter criteria and refreshes the table results.
ResetClears all active filter criteria and restores the full programme list. This control is only visible when at least one filter is active.

Programme Table Columns

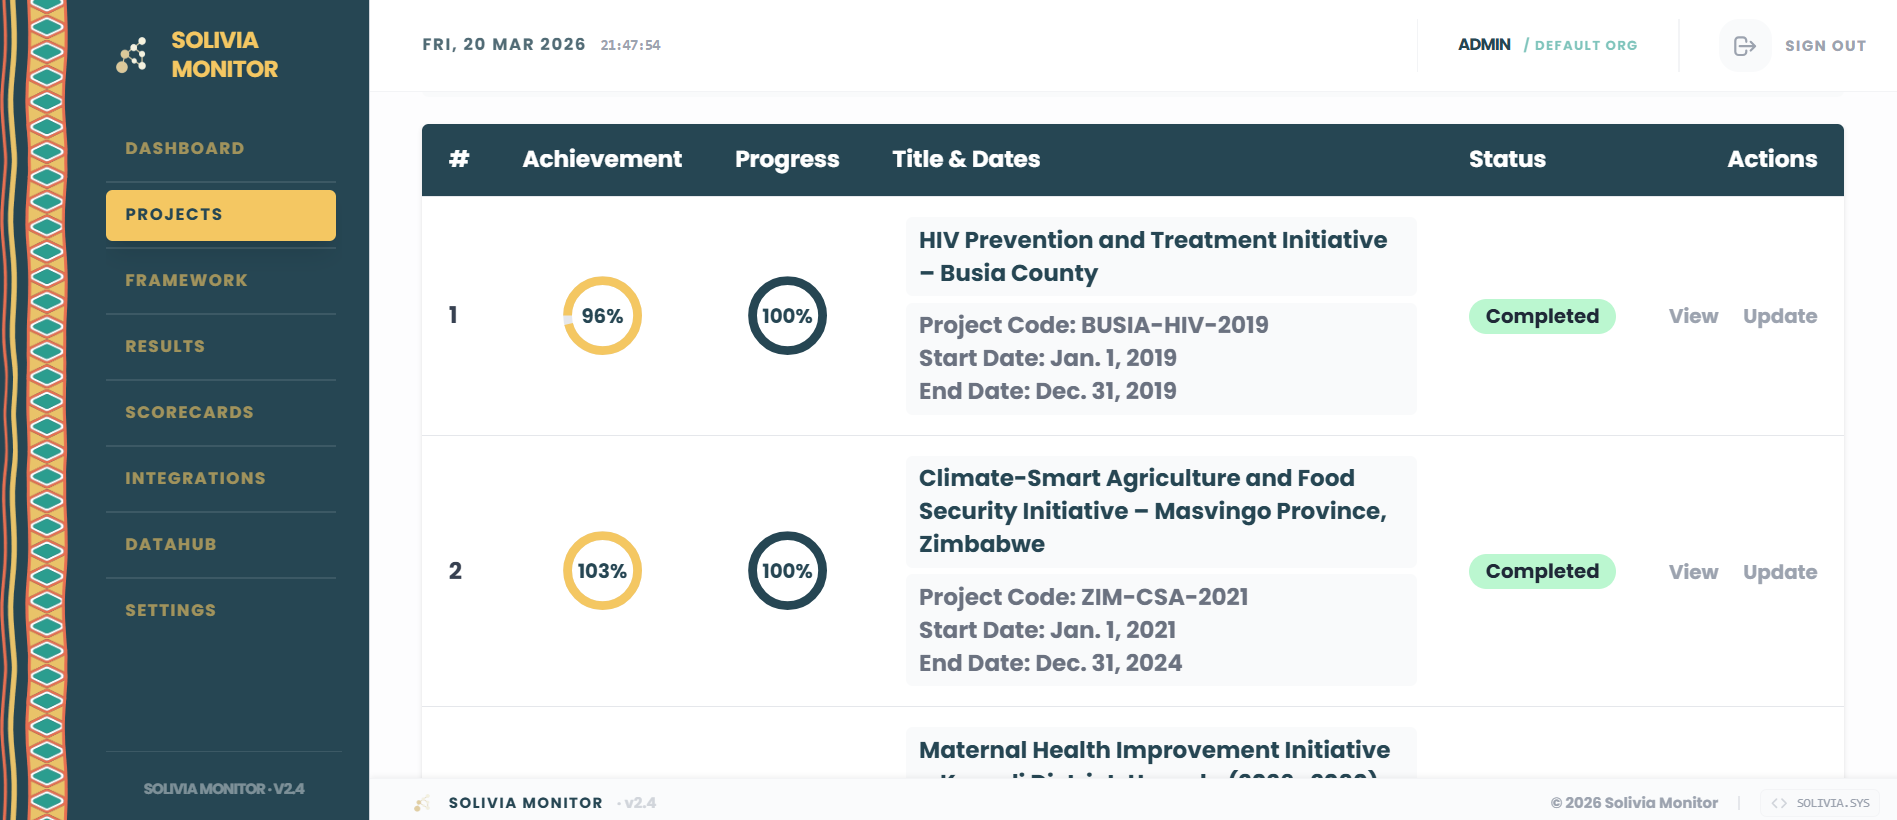
AchievementA donut chart representing the ratio of cumulative actual values to cumulative targets across all indicators, expressed as a percentage.
ProgressA donut chart representing the proportion of milestones (output activities) that have reached Completed status.
Title & DatesProgramme title, unique project code, start date, and scheduled end date.
Status BadgeA colour-coded pill reflecting the current programme status. Green = On Track; Yellow = At Risk / On Hold; Blue = Extended; Grey = Completed/Cancelled.
ViewNavigates to the Programme Detail page for the selected record, opening at the Overview tab.
UpdateOpens the Update Program Status modal, where the Stage and Status fields can be modified without leaving the registry view.
Projects – Detail Tabs
3b

Programme Detail Page

The Programme Detail page is accessible from the Projects Registry via the View action, or from the Dashboard via any Manage link. The page is structured around eight functional tabs, each covering a distinct dimension of programme management. Tab state is preserved in the URL query string, enabling direct linking to any section. An Export PDF button at the top produces a structured programme report.

1

Tab: Overview

The Overview tab presents the programme summary in a two-column layout. The left panel contains the core descriptive and operational fields; the right panel displays key headline statistics.

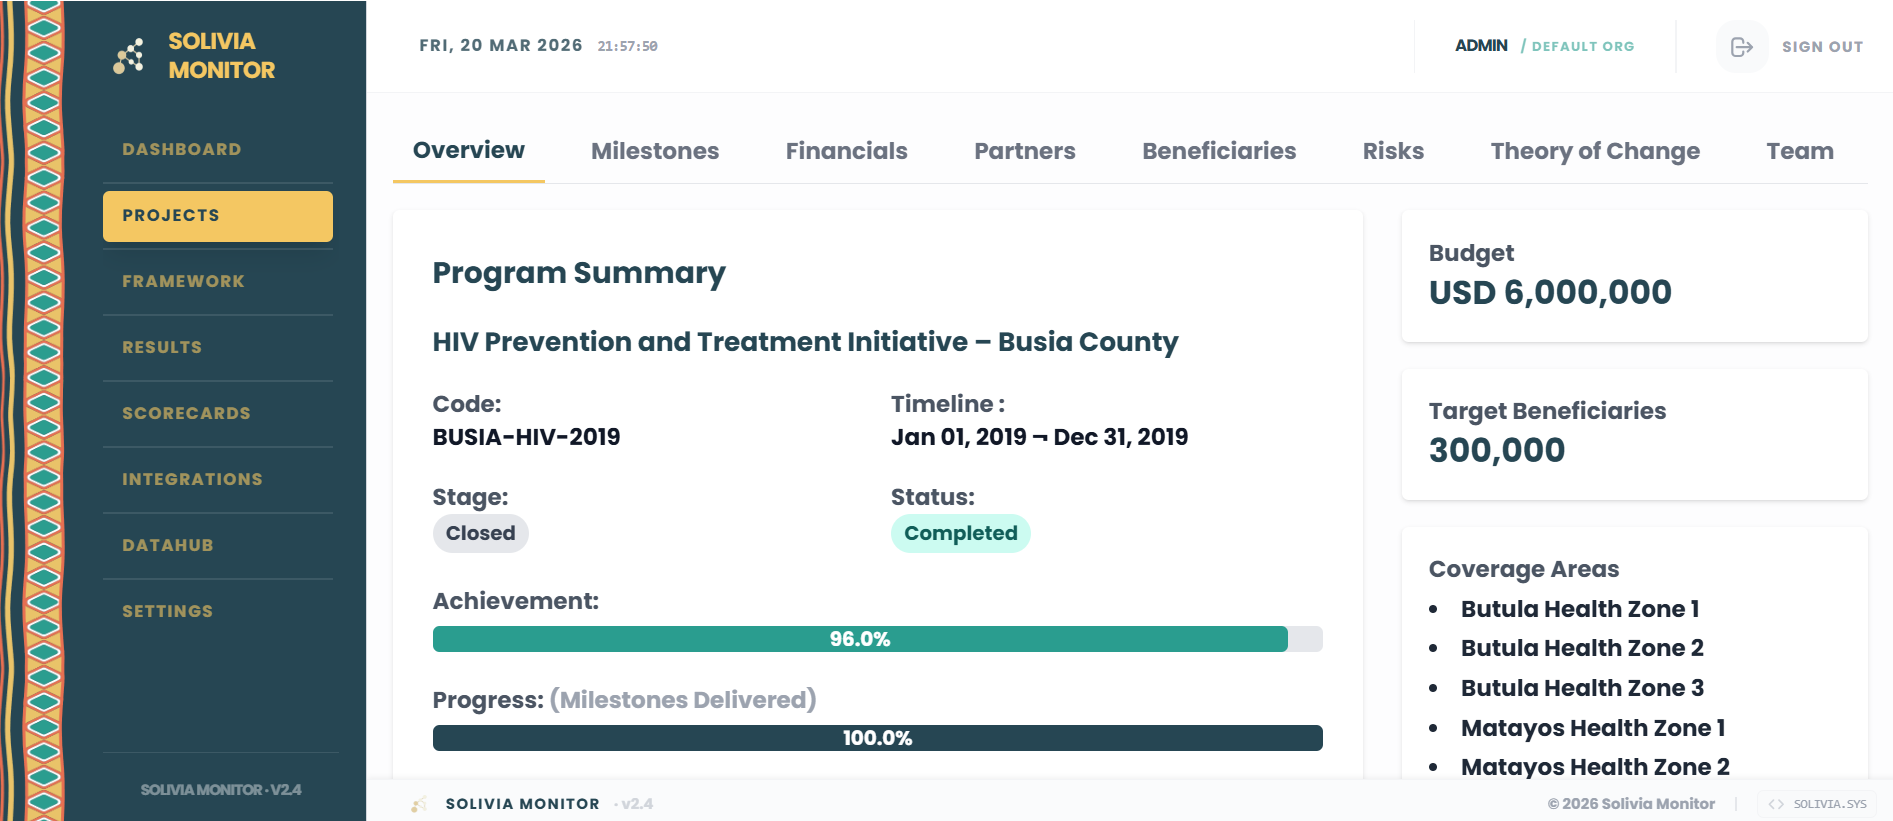
Programme SummaryDisplays the programme title, unique project code, and the full timeline (start date to end date).
Stage & Status BadgesColour-coded pills showing the current lifecycle stage (Planning, Execution, Closing, Closed) and operational status (On Track, At Risk, On Hold, Extended, Completed, Cancelled).
Achievement BarA horizontal progress bar showing the aggregate indicator achievement percentage (actual vs. cumulative target across all indicators).
Progress BarA second bar reflecting the proportion of programme milestones (output-level activities) marked as Completed.
Budget CardDisplays the total allocated budget in the organisation's default currency.
Target BeneficiariesThe aggregate planned reach figure as defined during programme setup.
Coverage AreasA paginated list of geographic/administrative units (sub-national locations) linked to this programme. Displays 5 items per page.
Programme DescriptionFull narrative text entered during programme creation. Includes audit fields: creation date, last updated date, and the user who created the record.
2

Tab: Milestones

The Milestones tab renders a Gantt chart of all output-level milestones and their associated activities. Milestone bars are rendered in dark teal; individual activities are nested beneath and colour-coded by calculated status.

View ControlsFour zoom buttons adjust the Gantt time axis: Day, Week, Month (default), and Year. The system selects Year automatically when the programme duration exceeds 365 days.
Status FiltersPill buttons filter the chart to activities matching a specific status. Available statuses: All Tasks, Not Started, Ongoing, Completed, On Hold, Late, Cancelled. The count of activities per status is displayed in parentheses.
Gantt ChartAn interactive horizontal bar chart. Hovering over any activity bar displays a tooltip with the activity name, date range, and colour-coded status badge. Bars are colour-coded: Green = Completed, Amber = Ongoing, Red = Late, Blue = On Hold, Dark Grey = Cancelled.
3

Tab: Financials

The Financials tab provides a comprehensive overview of programme budget utilisation, funding commitments, disbursement progress, and expenditure burn rate.

Financial Overview PanelContains two SVG donut charts: Funding vs Budget (committed funding as a percentage of the total budget, with surplus/deficit indicator) and Disbursement Rate (proportion of committed funding that has been disbursed).
Burn Rate PanelAn SVG donut showing the proportion of disbursed funds that have been spent (Spent ÷ Disbursed). Accompanied by the absolute Spent amount and Available Balance.
Disbursements TableA chronological ledger of all disbursement transactions: Date, Amount, and Purpose. Paginated at 5 rows per page. A totals row is shown at the foot.
Spending TableA parallel ledger recording actual expenditure events (Date, Amount, Purpose). Paginated at 5 rows per page. A totals row is shown at the foot.
4

Tab: Partners

The Partners tab consolidates all partnership and donor relationship data, including financial contribution tracking, type distribution analysis, and temporal engagement timelines.

Summary CardsFour headline metrics: Total Donors, Total Contribution (actual committed funding received), Active Partners, and Pending Disbursements (funding gap between expected and received).
Donor Contribution ProgressAn SVG donut displaying actual contributions as a percentage of the expected total commitment.
Partner Type DistributionA segmented donut and legend showing the breakdown of partners by type (Implementing, Funding, Technical, etc.).
Top Donors by ContributionA horizontal bar chart ranking the top 5 donors by their absolute financial contribution.
Disbursements Over TimeA stacked bar chart showing disbursement amounts by donor, grouped by reporting period.
Partnership TimelineHorizontal bars for each partner showing engagement duration relative to the programme's overall timeline.
Partners TableA paginated table of all implementing/technical partners. Columns: Name, Type, Contact Information, Address, Contribution Summary, and Terms of Reference (downloadable if attached).
Donors TableA paginated table of all funding donors. Columns: Name, Funding Type, Amount Contributed, Expected Total Commitment, Contact Information, Region, Disbursement Schedule, and Contract Document (downloadable if attached).
5

Tab: Beneficiaries

The Beneficiaries tab provides a multi-dimensional view of programme reach, disaggregated by beneficiary type, geographic location, and demographic split.

Summary CardsThree metric cards: Target Beneficiaries (planned total, disaggregated by gender), Direct Targets (those directly receiving programme services, by gender), and Indirect Targets (those benefiting indirectly through community spillover).
Location Breakdown TreeA hierarchical drill-down tree of geographic reporting units (e.g., County → Sub-County → Ward). Each node can be expanded to reveal a demographic matrix showing Direct and Indirect participants disaggregated by Male, Female, and Total. Nodes are searchable via the search input above the tree.
Active Areas IndicatorA summary bubble displaying the total number of unique geographic locations covered by the programme.
Beneficiary Locations MapAn interactive Leaflet.js map with circle markers positioned at each programme site. Marker radius is proportional to the beneficiary count at that location. Hovering a marker displays a popup with the site name and total count.
6

Tab: Risks

The Risks tab maintains the programme's risk register. Each identified risk is documented with its likelihood, potential impact, and an assigned owner responsible for mitigation.

+ Add RiskOpens the risk creation form. Requires a description, likelihood rating, impact rating, and an optional owner assignment.
Risk TableA paginated register (5 rows per page) listing all recorded risks. Columns: #, Description (truncated to 80 characters), Likelihood, Impact, Owner, and row-level Edit and Delete actions.
7

Tab: Theory of Change

The Theory of Change tab visualises the causal logic of the programme as a series of IF WE → THEN WE statements. Each card represents one causal link between an Output-level intervention and its expected Outcome.

ToC Link CardsEach card contains: an IF WE label with the Output (the intervention or activity cluster), a THEN WE label with the expected Outcome, and an optional Rationale section explaining the causal assumption. Cards are displayed in a responsive grid (up to 3 columns).
Empty StateWhen no ToC links have been defined, a message is displayed directing users to the Framework Maintenance panel to establish causal links.
8

Tab: Team

The Team tab lists all platform users assigned to this specific programme. It is distinct from the organisation-wide Team Management section in Settings, which covers all users across the organisation.

+ Add Team MemberAssigns an existing organisation user to this programme. The user's system role and contact details are inherited from their platform profile.
Team TableA paginated table (5 rows per page) of assigned members. Columns: #, Full Name, Email Address, Platform Role, and row-level Edit and Remove actions. Removing a member withdraws their programme-level assignment but does not delete their platform account.
04

Strategic Framework

The Framework module provides the interface for constructing and maintaining the logical hierarchy of a programme — linking Goals to Outcomes, Outcomes to Outputs, and Outputs to Activities and Indicators. A programme selector dropdown at the top allows switching between programmes. The + Add New Program button opens a modal for creating a new programme record directly from this screen.

Tab: Builder
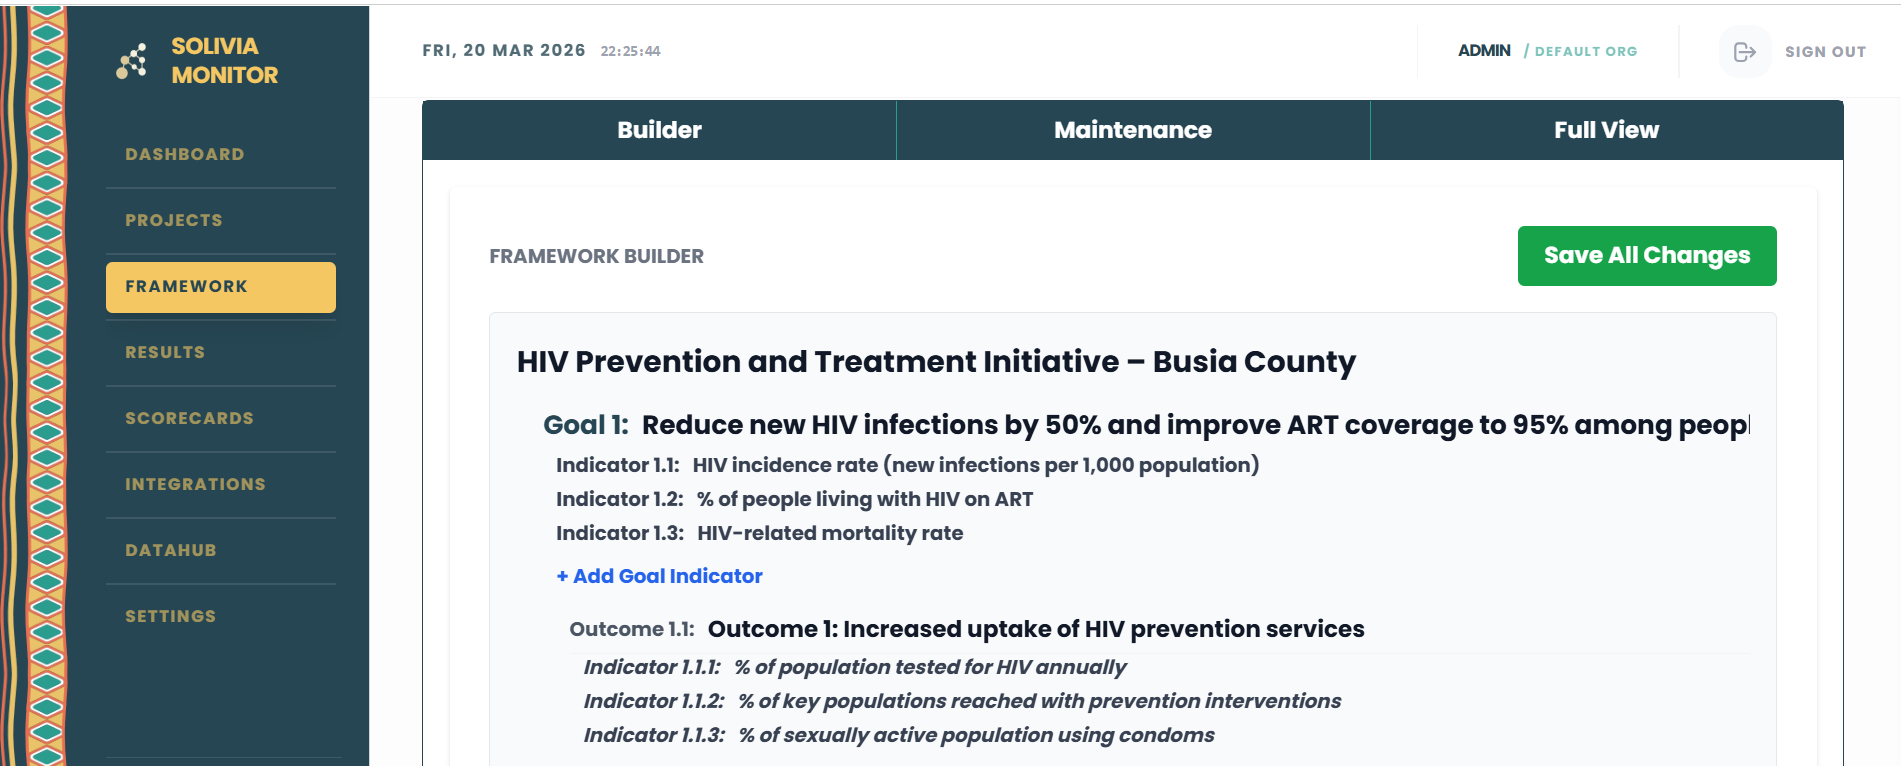
Framework Builder

The Builder tab is the primary interface for constructing the programme's Theory of Change architecture. Goals, Outcomes, Outputs, Activities, and Indicators are created and arranged in a nested, expandable hierarchy. All elements can be added, edited, and connected from this view.

Tab: Maintenance
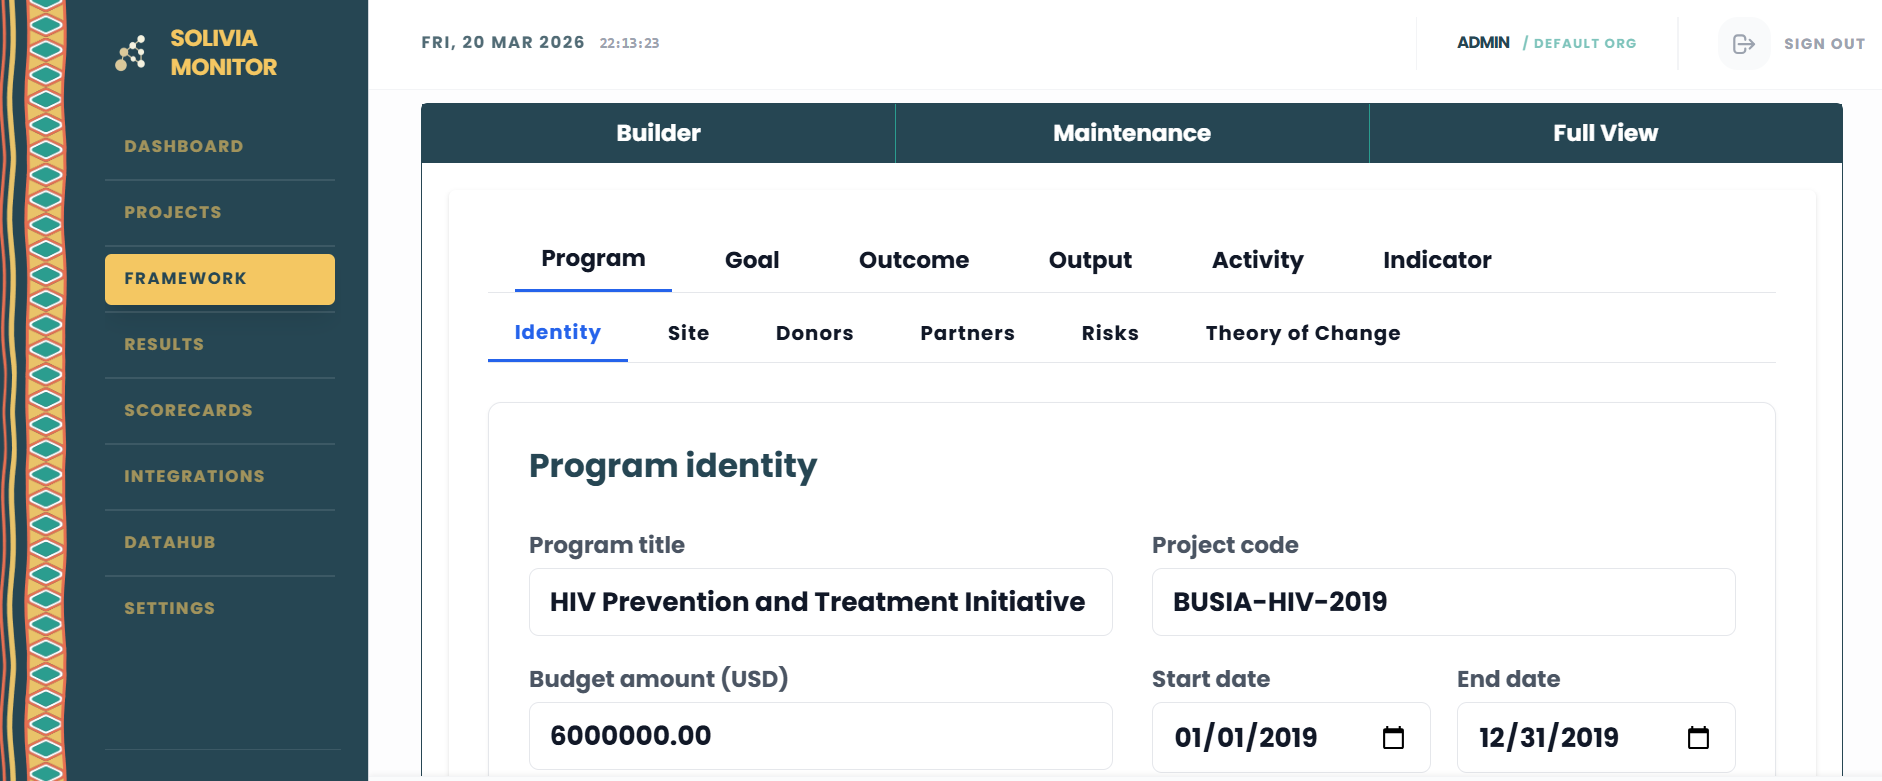
Framework Maintenance

The Maintenance tab provides a detailed editing interface for modifying all existing framework elements. It is subdivided into six specific main tabs that correspond to the programme context and logical levels of the Theory of Change:

Program

Acts as the core configuration engine for the programme. Data registered here drives modules, dropdowns, and calculations across the rest of the system via six sub-tabs:

  • Identity: Configure the core programme title, total budget capacity, unique project code, start date, and end date.
  • Site (Targets): Define the overall target beneficiaries benchmark to drive organisation-wide reach algorithms and coverage statistics.
  • Donors: Register new financial contributors along with their funding types (Grant/Loan/Co-funding) and committed amounts, which subsequently populate the Financials and Partners modules.
  • Partners: Onboard external entities and explicitly assign their operational roles (Implementing, Technical, Funding, Advocacy) for system-wide assignment.
  • Risks: Build the programme's foundational risk registry by logging specific risk descriptions alongside their exact Likelihood and Impact ratings.
  • Theory of Change: Wire the causal logic engine by explicitly linking predefined Outputs to specific Outcomes, complete with explanatory rationales.
GoalAllows modification of the overarching programme Goal title and narrative description.
OutcomesLists all defined Outcomes. Each can be edited to update its title and description.
OutputsLists all defined Outputs. Each can be edited to update its title and description.
ActivitiesLists all activities (milestones). Editable fields include Title, Description, Start Date, and End Date. These dates drive the Gantt chart in the Programme Milestones view.
Indicators

The most comprehensive sub-tab, allowing deep configuration of each indicator's measurement parameters:

  • Core Configuration: Name, Description, and Logical Level (Goal, Outcome, or Output).
  • Measurement Rules: Indicator Type (Percentage, Rate, Proportion, Average, Boolean, or Number) and reporting Frequency.
  • Cross-cutting: Multi-select assignment of Disaggregations (e.g., Male/Female, Age Brackets) to the indicator.
  • Targets: Base numeric Baseline, cumulative Target value, and Means of Verification (MoV).
  • Manual Data Injection: A secondary form interface to manually inject historical or ad-hoc actual values outside the main Results module. This includes granular assignment to an Organisational Unit, calculation components (Numerator/Denominator) depending on the indicator type, specific disaggregated values, and narrative comments.

Tab: Full View
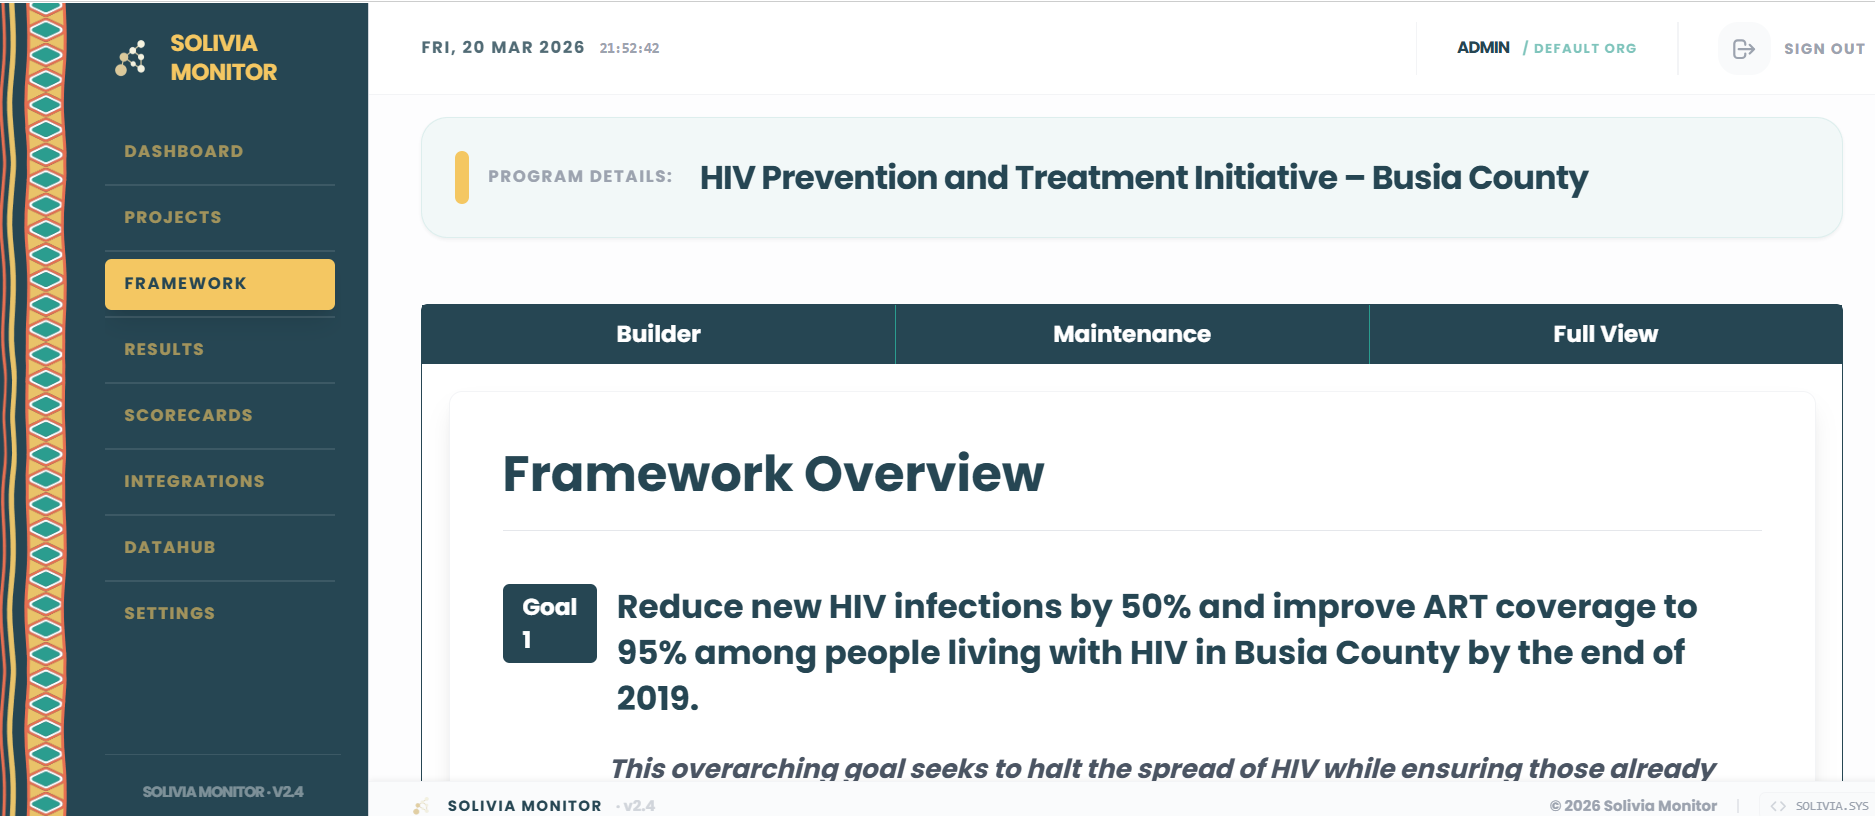
Framework Full View

The Full View tab renders a read-only, top-down representation of the complete programme architecture in a single scrollable layout. This view is intended for programme integrity review and stakeholder reporting.

05

Results & Indicator Tracking

Results

The Results module serves as the primary data entry interface for M&E operations. It utilizes a split-pane architecture to allow users to navigate complex programmatic hierarchies while entering data without losing context.

Interface Components
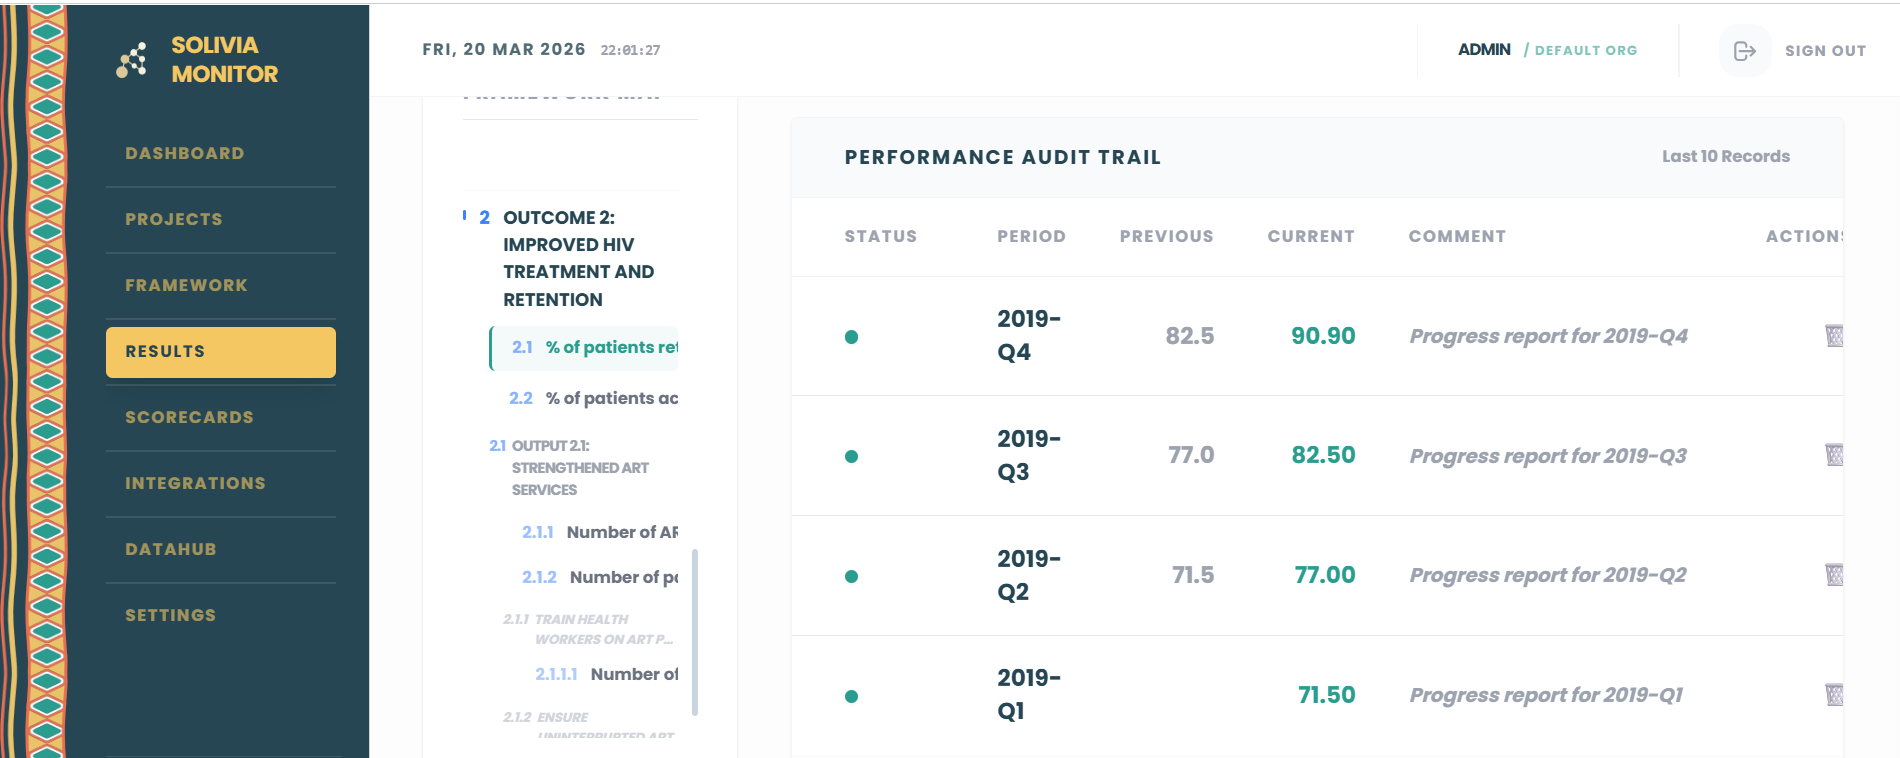
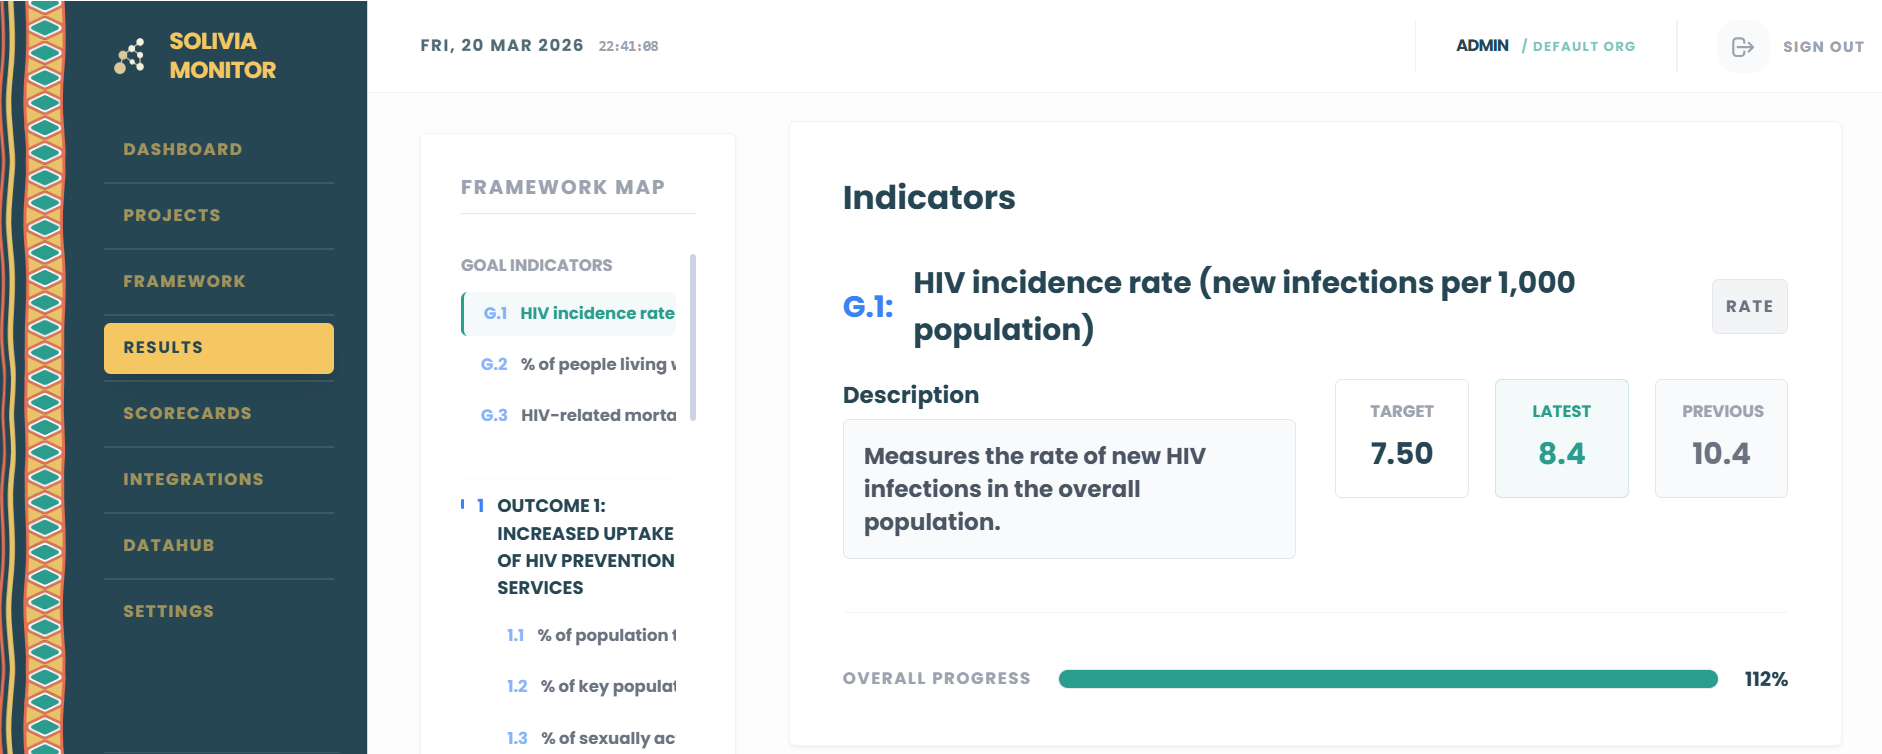
Framework MapA sticky navigation tree on the left. It hierarchically lists all indicators categorized by parent entity (Goal, Outcome, Output, Activity). Selecting an indicator loads its tracker.
Identity PanelDisplays the selected indicator's full description, targeted reach, latest value achieved, and overall graphical progress bar toward the target.
Data Entry FormThe primary interface for submitting periodic results. Requires the specific reporting period, the absolute numeric value recorded, and an optional narrative comment explaining variance.
Audit TrailA tabular ledger displaying the 10 most recent data entries for the selected indicator. Shows reporting period, previous/current values, narrative comment, and delete/reverse actions.
Results – Detail
06

Performance Scorecards

Scorecards

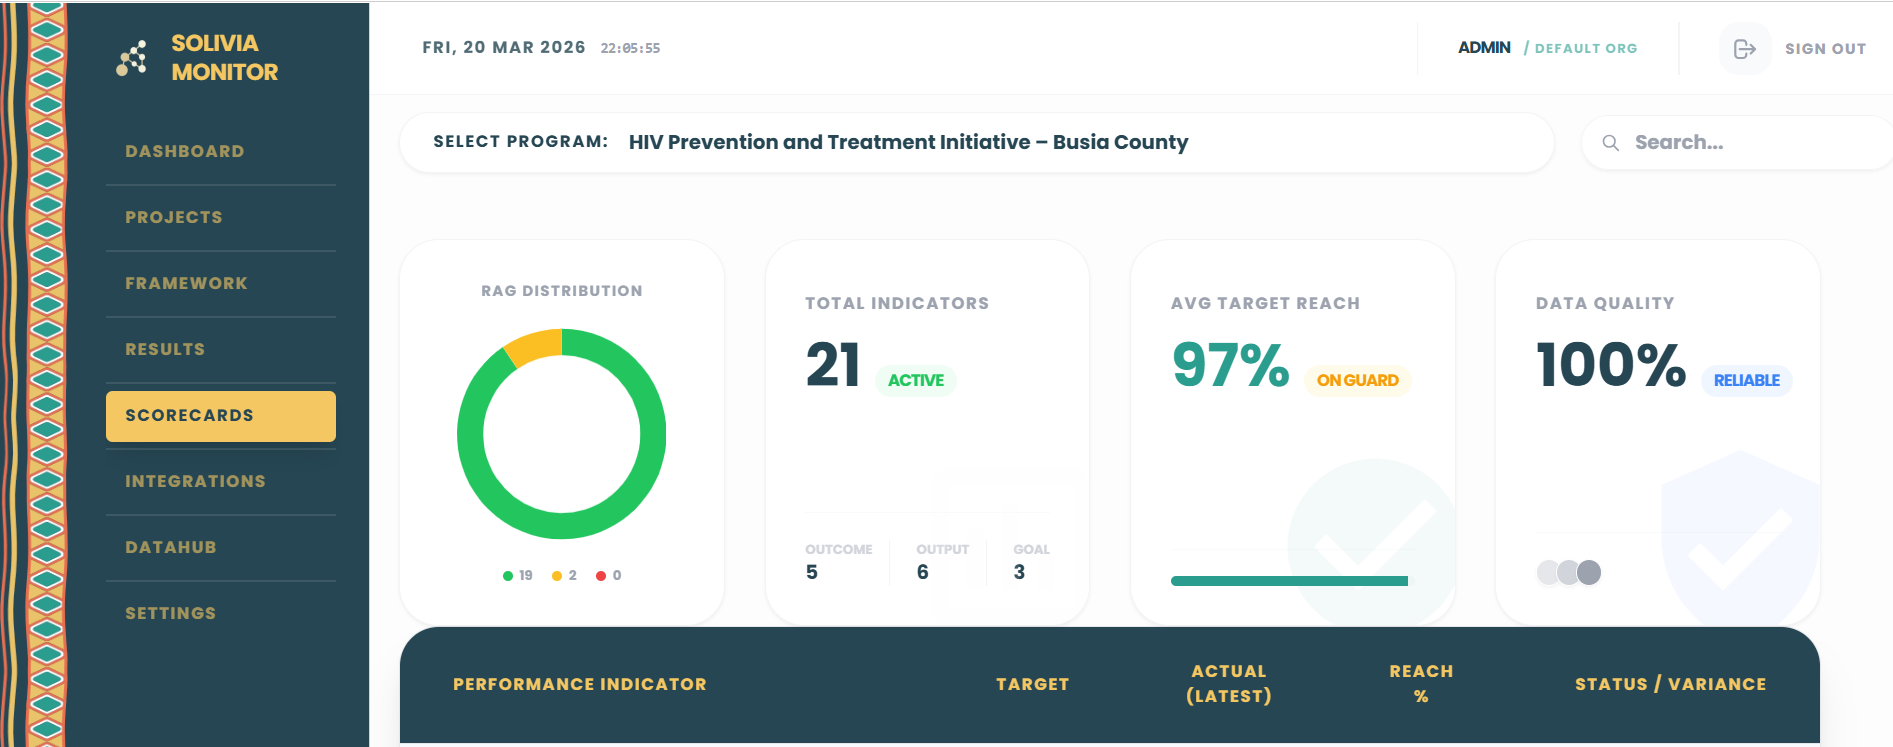
Scorecards generate automated performance assessments based on data entered in the Results module. The interface functions as an executive dashboard equipped with visual KPIs and a comprehensive algorithmic RAG ledger.

Performance Summary (KPIs)

RAG DistributionA Doughnut chart visualizing the proportion of indicators in Green, Amber, and Red status.
Total IndicatorsCount of active indicators broken down by Goal, Outcome, and Output levels.
Avg Target ReachThe aggregate achievement percentage tracked across the entire programme.
Data QualityA reliability index derived from reporting frequency and completeness metrics.

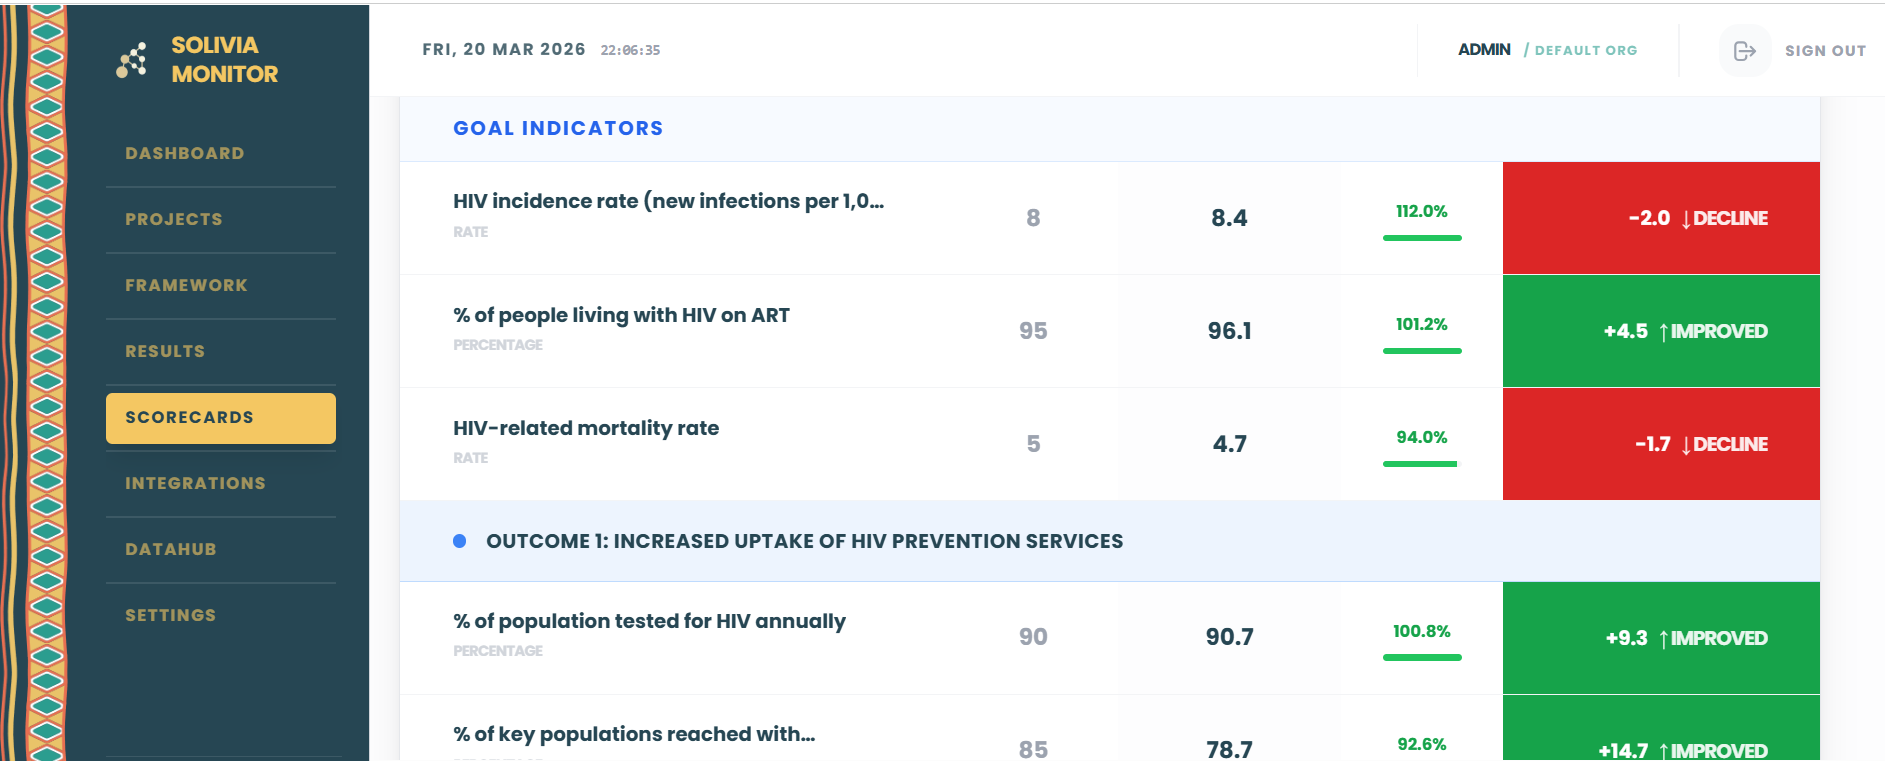
Scorecard Ledger

StructureA comprehensive table grouping all indicators hierarchically (Goal → Outcome → Output).
Target vs. ActualThe cumulative target against the latest aggregate achievement.
Reach %The calculated ratio of actual to target achievement.
Status VarianceAuto-calculated variance from target: Green (≥ 80%), Amber (50–79%), Red (< 50%).
Scorecards – Detail
07

DataHub — Central Registry

DataHub

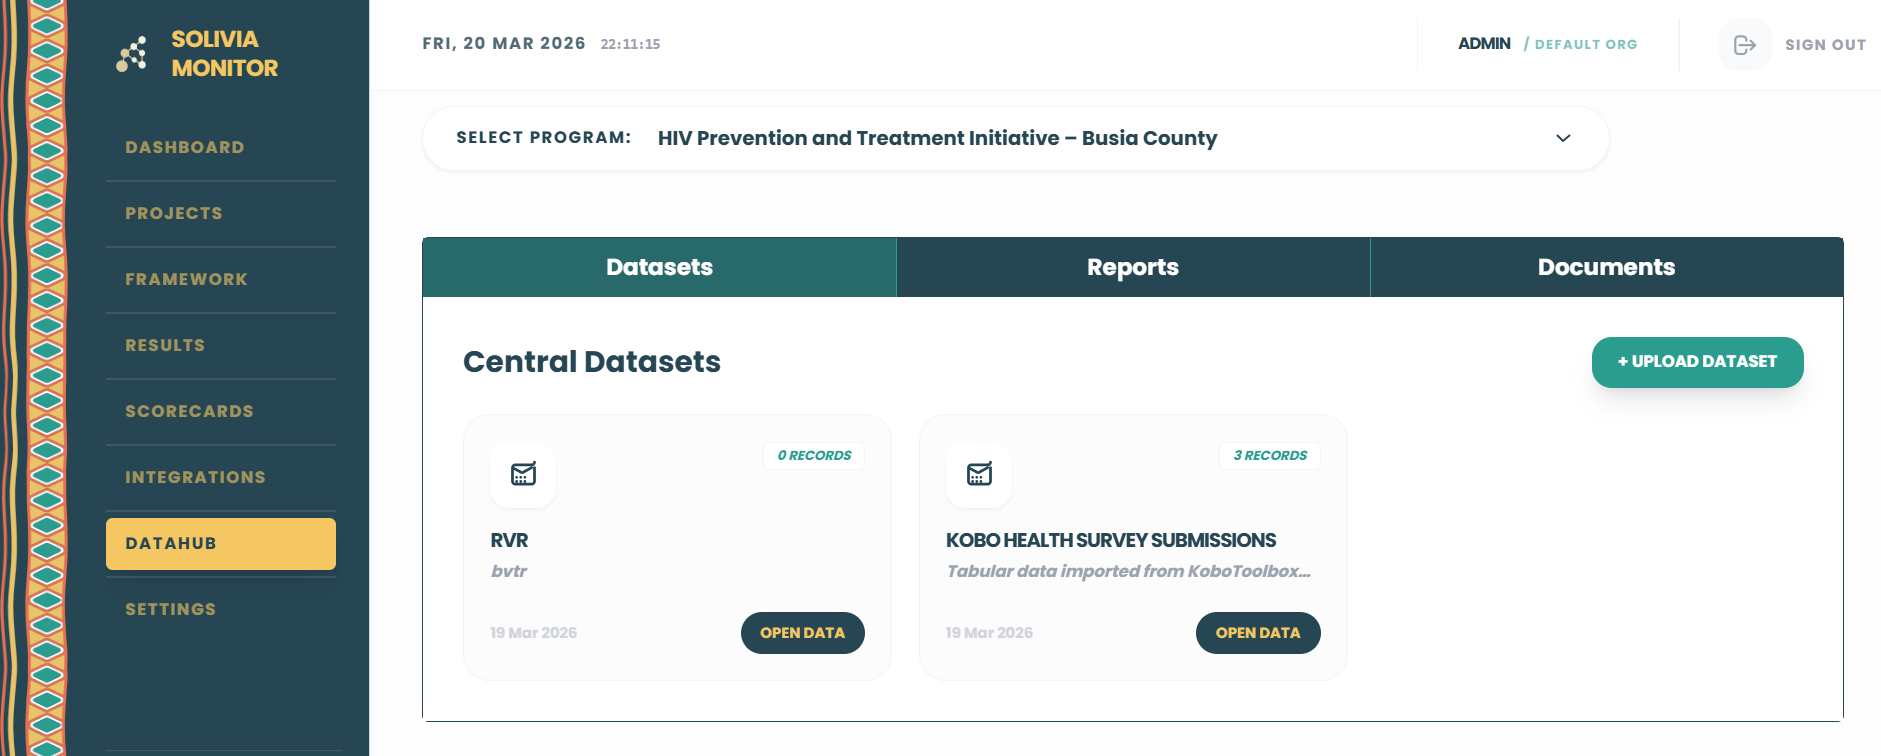
The DataHub centralises all structured data, narrative documentation, and file attachments associated with the organisation's programmes. A programme selector at the top filters content by programme context. Three tabs organise content by type.

Tab: Datasets

Dataset CardsEach uploaded dataset is represented as a card displaying the dataset name, record count, and upload date. The Open Data action opens the dataset in a tabular explorer with search and per-column filtering capabilities.
+ Upload DatasetOpens a modal requiring: Dataset Name, optional Description, and a file upload (CSV or Excel format). The system parses the file and indexes it as a queryable dataset.

Tab: Reports

Report CardsEach report record displays the title, type classification (Internal Progress, Donor, or Final Project), and the reporting date. The View action opens the full report detail. The Down action downloads the attached file if one is present.
+ Upload ReportOpens a modal requiring: Report Title, Report Type, optional Programme Link, optional File Attachment, and an Executive Summary narrative.

Tab: Documents

Document VaultAll uploaded files are displayed as icon cards categorised by document type (PDF, Spreadsheet, Word, Image, Other). The Info link opens the document's metadata detail page. The Get link initiates a file download.
+ Upload DocumentOpens a modal requiring: Document Title, Document Type selection, optional Programme Link, and file upload.
08

Data Integrations

Integrations

The Integrations module enables automated connections to external data collection platforms and cloud storage systems, alongside tools for bulk manual imports. It is organized into three primary operational tabs.

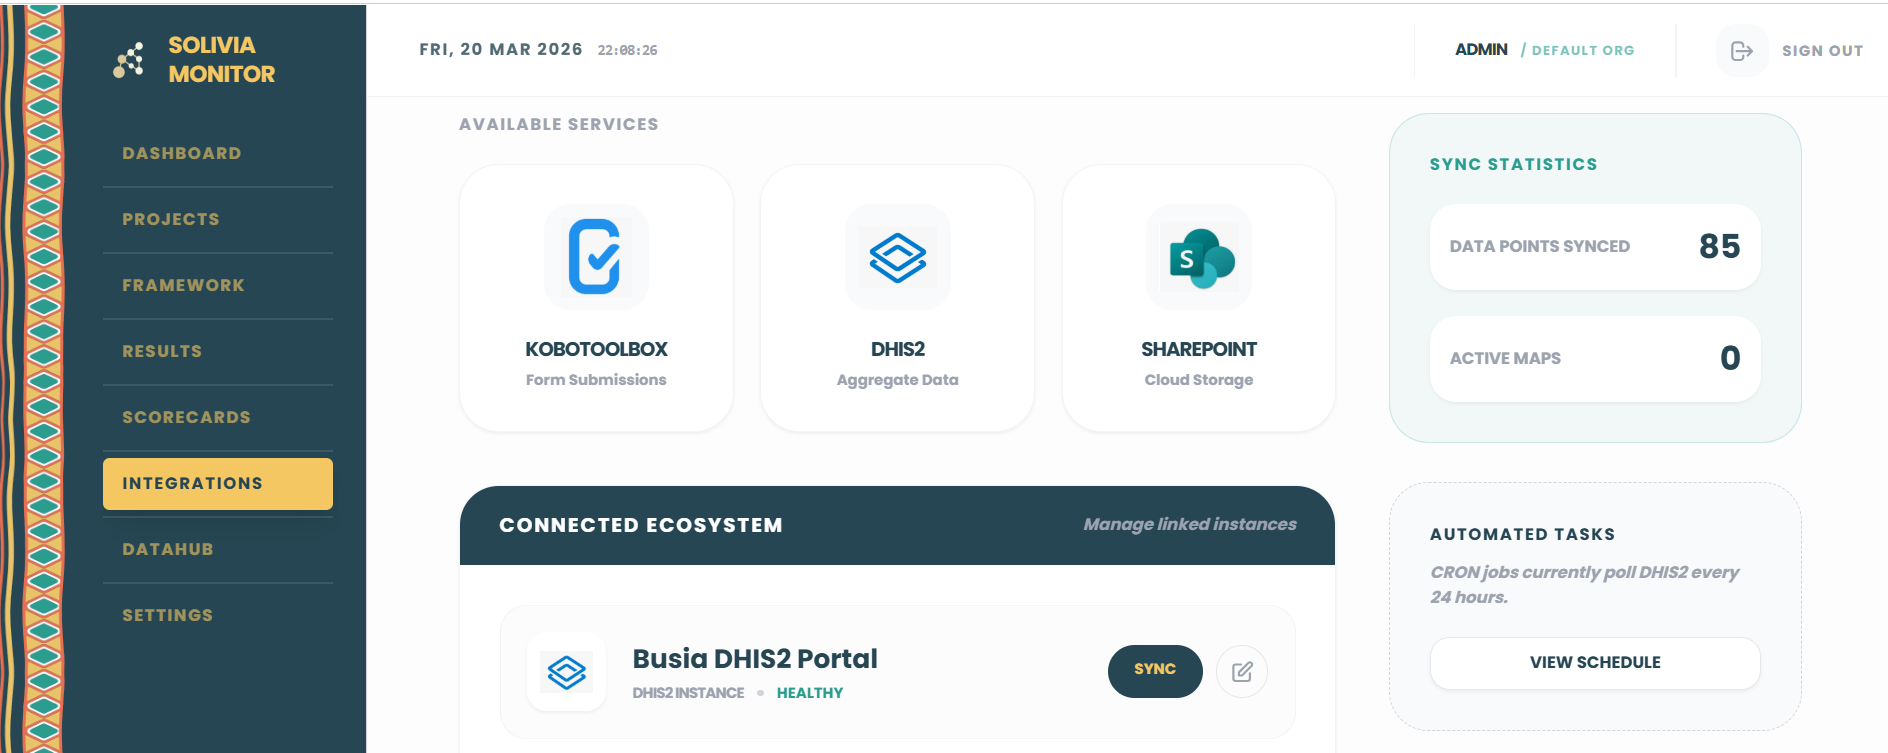
Tab: Services

Available ConnectorsThe marketplace for configuring new external links. Supported platforms include KoboToolbox, DHIS2, and SharePoint.
Connected EcosystemLists all actively linked instances. Displays the service health status and provides a manual Sync action to trigger an immediate data pull.
System CardsDisplays live synchronization statistics (total Data Points Synced, Active Maps) and the schedule for automated tasks.

Tab: Import

Bulk Indicator UploadProvides an interface for updating multiple mathematical/numeric indicator values simultaneously via Excel or CSV. Users can download a standardized template matrix to ensure data integrity during upload.

Tab: Sync Logs

Historical HistoryAn immutable 30-day ledger detailing all inbound data traffic operations. Each log specifies the source service, exact timestamp, success/failure status, and the volume of data points retrieved.
09

Organisation Settings

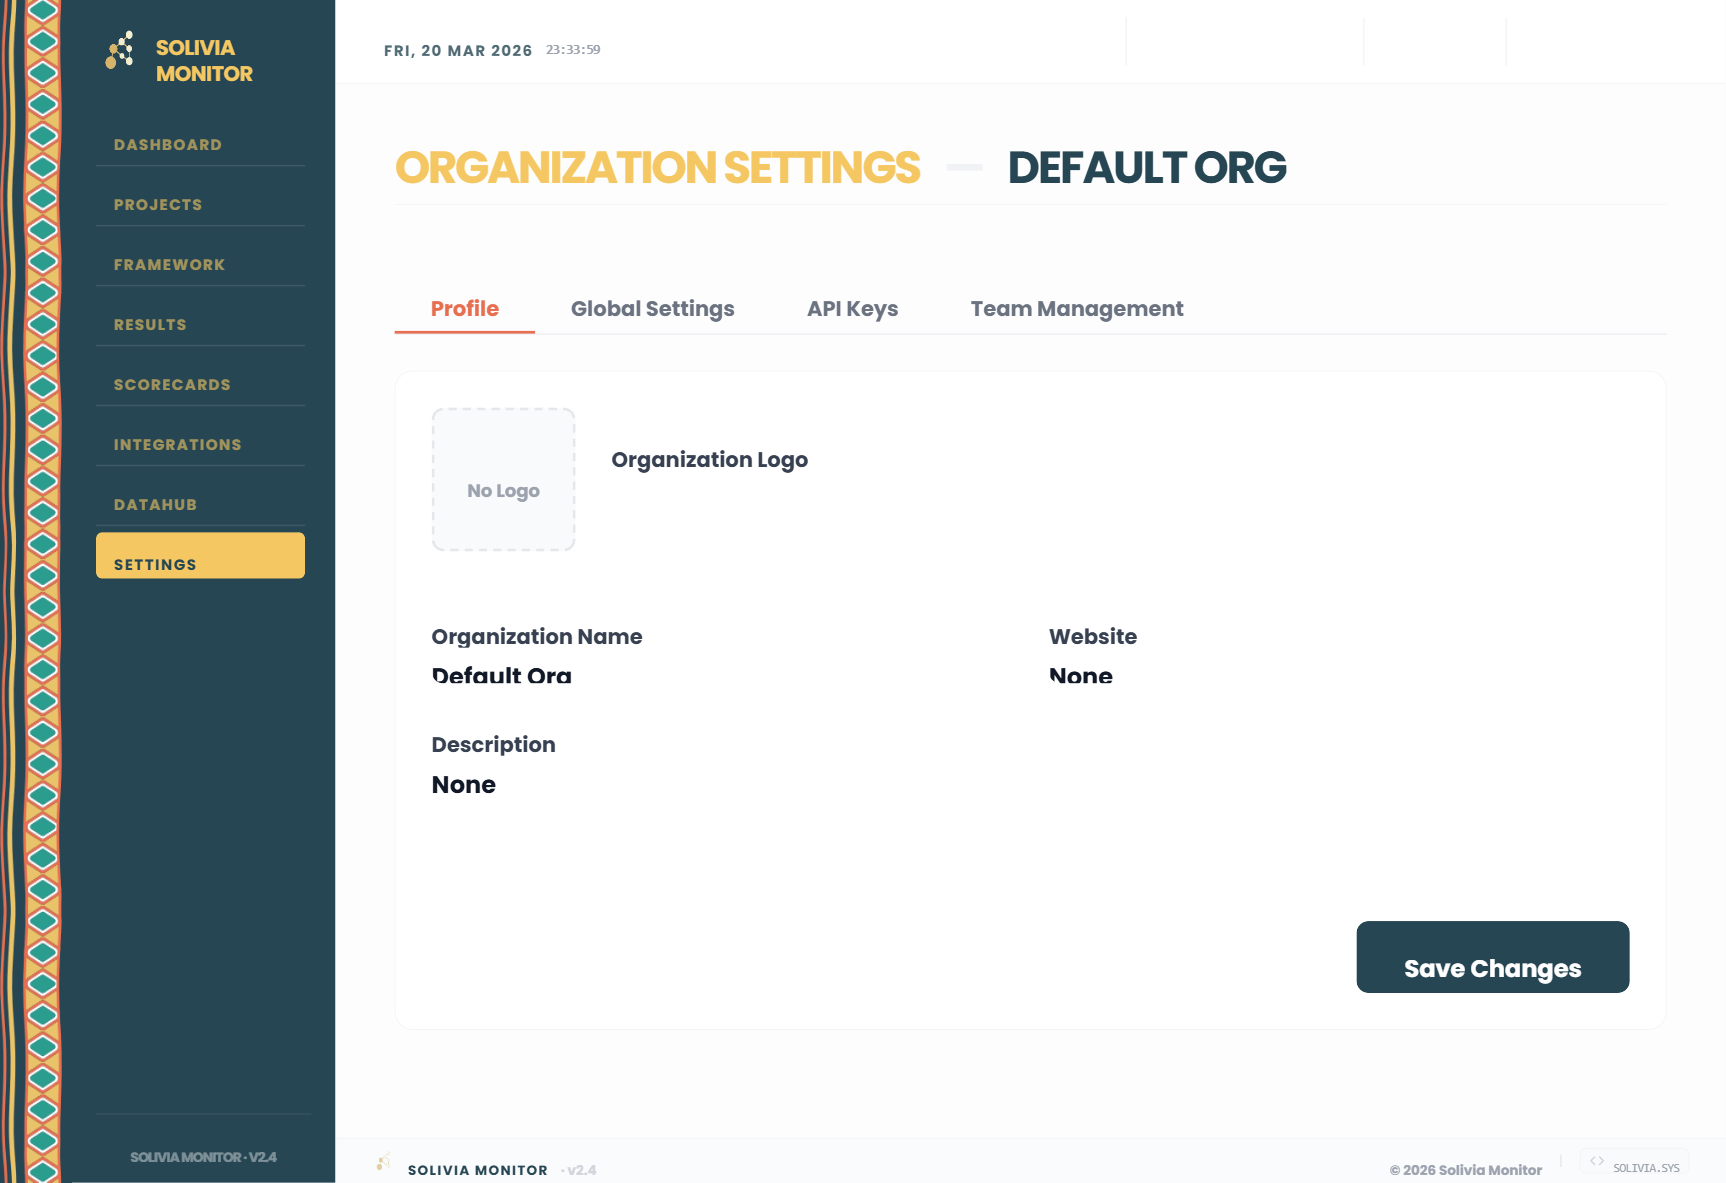
Settings

The Settings page is restricted to users with the Administrator role. It provides configuration controls for the organisation profile, system-wide defaults, programmatic API access, and user account management.

Tab: Profile

Organisation LogoUpload a PNG or JPG image. The logo is displayed in the sidebar navigation and on exported reports.
Organisation NameThe official registered name of the organisation, used across all interfaces and generated documents.
WebsiteThe organisation's public URL, displayed on exported documents.
DescriptionA narrative description of the organisation's mandate or mission. Displayed on relevant export templates.
Save ChangesPersists all profile field modifications to the database.

Tab: Global Settings

Default CurrencySets the currency symbol and code applied to all financial fields and generated reports across the platform. Options include USD, EUR, GBP, KES, UGX, TZS, and NGN.
TimezoneDetermines how all system-generated timestamps and date fields are presented to users. Options include UTC, Africa/Nairobi, Africa/Lagos, Africa/Johannesburg, and Europe/London.
Fiscal Year StartDefines the date on which the organisation's financial year begins, used as the basis for financial reporting period calculations.
Update PreferencesSaves all global setting changes to the organisation record.

Tab: API Keys

Generate New KeyCreates a new API credential by entering a descriptive label (e.g., "Mobile App", "Power BI Connector") and clicking Generate. The full key value is displayed only once at the time of generation.
API Keys TableLists all previously generated keys with a masked preview (first 8 and last 4 characters visible), creation date, and Active/Inactive status. API keys grant programmatic access to all organisational data and must be stored securely.

Team Management

Accessible via the dedicated link in the Settings tab bar. Administrators can invite users by email, assign platform roles (Admin, Manager, Viewer), and deactivate accounts. Access permissions are enforced system-wide based on the assigned role. This section governs organisation-level user accounts, distinct from programme-level team assignments managed within each Programme Detail page.

Solivia Monitor · System Documentation · v1.0

For API integration reference, consult the API Keys section within Organisation Settings.